What Companies Actually Spend on AI Coding Tools in 2026

Nearly a quarter of technology leaders now spend between $200 and $500 per developer per month on AI coding tokens, and about 6% spend more than $2,000. Those are Gartner's numbers, published in June 2026. The seat license — the $20 line everyone quotes — is a rounding error next to them.
2026 is the year the bills arrived. Uber burned its annual AI coding budget in four months. Microsoft cancelled internal Claude Code licenses across an entire division. Amazon and Meta both shut down the leaderboards they had used to encourage consumption a year earlier. This is what the receipts look like, where the money actually goes, and why almost nobody saw it coming.
What companies spend per developer, per month
Four sources, four different vantage points, one consistent picture.
| Source | What it measures | Figure |
|---|---|---|
| Gartner, Jun 2026 | Tech leaders spending $200–$500/dev/month on tokens | 23% |
| Gartner, Jun 2026 | Tech leaders spending over $2,000/dev/month | ~6% |
| Microsoft (internal, reported) | Per-engineer API cost before cancellation | $500–$2,000/mo |
| Uber (internal, reported) | Cap imposed per employee, per agentic tool | $1,500/mo |
| Ramp, Jul 2026 | AI spend per employee, top 1% of US businesses | $7,400 |
| Ramp, Jul 2026 | AI spend per employee, median US business | $11.95 |
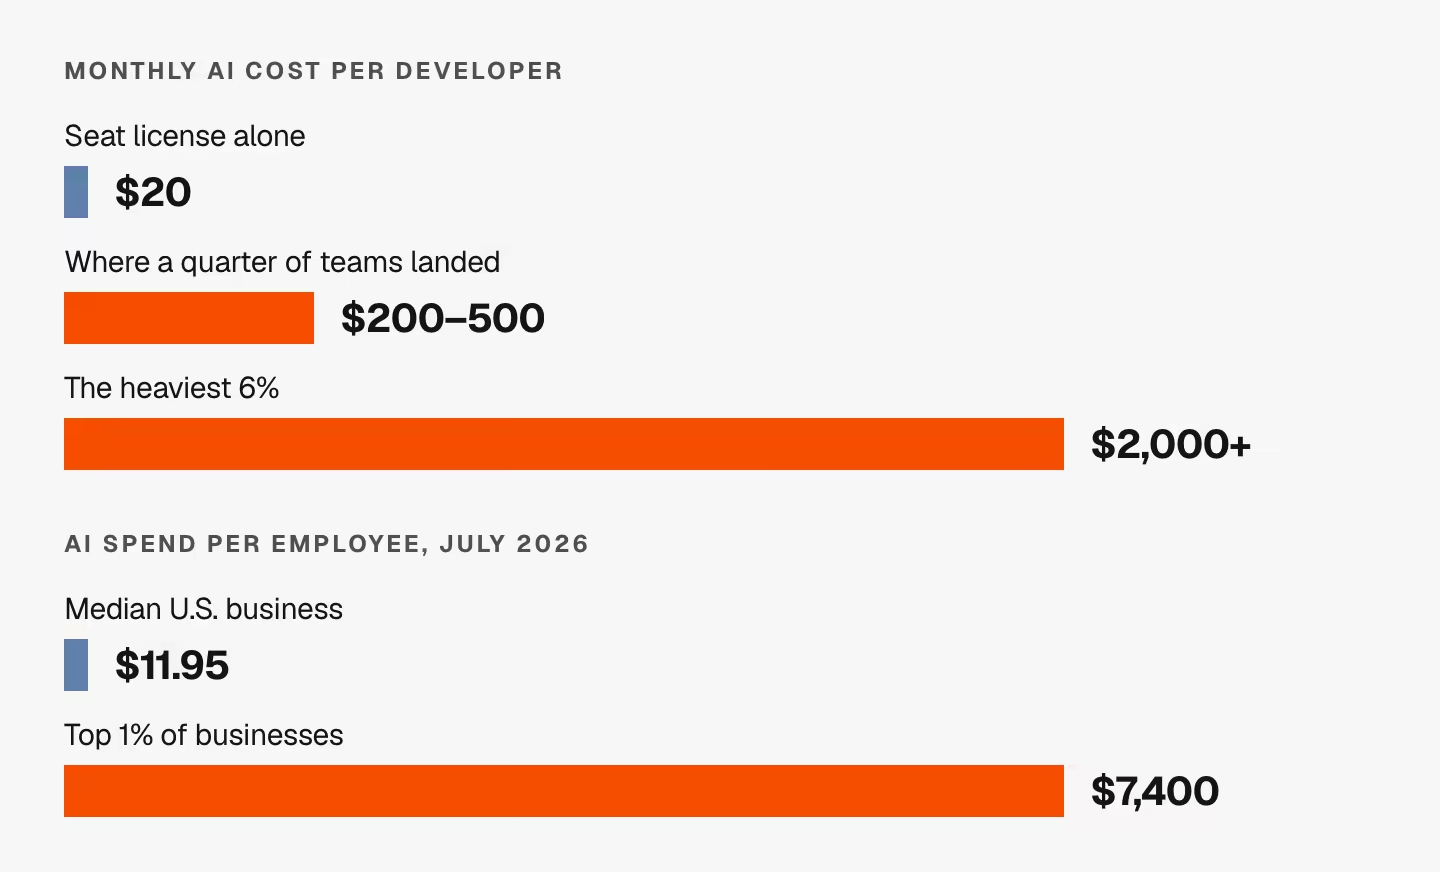
Two things jump out of that table.
The first is the spread. Ramp's index, built from anonymized transaction data across more than 70,000 businesses, has the top 1% of companies spending roughly 620 times what the median company spends per employee. This is not a market with a going rate. It is a market where a handful of firms have restructured how they work around these tools and everyone else is buying a subscription.
The second is that the seat is no longer the product. A Copilot or Cursor seat is $20 to $40 a month. Gartner's midpoint is roughly ten times that, and the gap is entirely consumption — tokens burned by agents running long, context-heavy sessions. You cannot forecast that from a price page, which is precisely how so many 2026 budgets went wrong.
The budgets were set 3x too low
Here is the most useful comparison I found, because it catches the industry mid-error.
In October 2025, DX surveyed engineering budget holders about 2026 planning. The common target that emerged was $1,000 per developer per year, with a predicted range of $500 to $3,000+. Nearly half of leaders were allocating 1–3% of their engineering budget to AI tools.
Eight months later, Gartner found a quarter of leaders spending $200–$500 per developer per month. Annualized, that is $2,400 to $6,000 — two to six times the plan, in the same fiscal year the plan was written for.
That is not a forecasting failure by unusually careless people. It is what happens when you budget a consumption line as though it were a licence: you count developers, multiply by a seat price, and add a cushion. The cushion was sized for a variable that turned out to have no ceiling.
Where the money goes at the market level
Zoom out from the per-developer line and the shape is the same, one layer up.
Menlo Ventures put total enterprise AI spend at $37 billion in 2025, roughly tripling year over year, with $12.5 billion of that going to foundation model APIs. Coding was already a $4 billion category on its own and the single strongest driver of model choice: Anthropic took 40% of enterprise LLM spend, up from 24% the year before, with OpenAI at 27% and Google at 21%.
Ramp's July 2026 data shows the same story in adoption rather than dollars: 43.5% of US businesses paid for Anthropic subscriptions or tokens that month, against 39.7% for OpenAI. Vendor revenue tracks it. Anthropic's own announcements put its run-rate revenue at $9 billion at the end of 2025, $14 billion in February 2026, $30 billion in April and $47 billion by May — more than fivefold in about four months, much of it downstream of code.
Money moving that fast into one category means the category is delivering something. It also means nobody involved has a stable baseline for what normal spend looks like.
The 2026 correction
Then, in a single quarter, four of the largest engineering organizations in the world hit the brakes. In order:
| When | Who | What happened |
|---|---|---|
| Jun 2026 | Amazon | Shut down its internal AI usage leaderboard after employees gamed it. Internal name for the behaviour: tokenmaxxing |
| May–Jun 2026 | Microsoft | Cancelled most internal Claude Code licenses in Experiences + Devices, moving thousands of engineers to Copilot CLI by June 30 |
| Jun 2026 | Uber | Exhausted its 2026 AI coding budget by April; capped spend at $1,500 per employee per month per agentic tool |
| Jul 2026 | Meta | After killing its Claudeonomics leaderboard, Adam Mosseri said per-engineer token budgets may need caps within "a year or two" |
The details rhyme in a way worth noticing.
Every one of these companies had encouraged consumption first. Uber ranked employees on internal leaderboards before it capped them. Amazon's leaderboard was, in its own words, meant to get people using the tools — employees told 404 Media it was easily cheated and encouraged wasteful use. Meta's Claudeonomics dashboard aggregated some 60 trillion tokens across a 30-day window before it was pulled. I wrote about how that culture formed in What is tokenmaxxing? — the short version is that "tokens used" got adopted as a productivity proxy precisely because it was the only number anyone could see.
And note what the corrections were not. Nobody banned the tools. Uber set a cap and shipped a dashboard so employees could watch their own number. Mosseri's framing was budgetary, not moral: tokens as a resource to allocate by team, weighted by "trust in their ability to use the budget in an 'ROI-positive' way." He also described some internal usage as "token incinerators" — which is the honest word for what an unattended agent loop does.
Microsoft is the exception that proves the rule: it consolidated onto a tool it owns. When per-engineer API costs are running $500–$2,000 a month, first-party billing is a lever nobody else has.
Why the bills surprised everyone
A seat is a fixed price for access. A token bill is a variable price for work performed, and it is metered on four counters, not one: input, output, cache writes and cache reads. Each has a different rate.
That structure has three consequences that break intuition:
- Cost scales with session length, not task difficulty. An agent re-reads its accumulated context on every turn. A long session pays for the same context repeatedly, so a one-hour refactor can cost more than a hard bug fixed in ten minutes.
- Token counts tell you almost nothing about cost. In my own logs, 1.3 billion tokens over twelve days cost $1,422 — about $1 per million — because over 95% of those tokens were cache reads billed at a fraction of the input rate. Guessing from the raw count would have put that month in five figures.
- Model tier dominates. Across the same measured window, the spread between the cheapest and priciest model I used was roughly nine to one per million tokens. That is a bigger lever than which tool you standardize on, and it is a setting.
Gartner's analyst put the strategic version of this plainly: "There is no direct relation between the increase in token consumption and an increase in productivity gains." A leaderboard that ranks people by tokens is measuring the meter, not the work.
What $200–$500 a month actually buys
Industry averages are hard to feel, so let me convert them into something you can check against your own week.
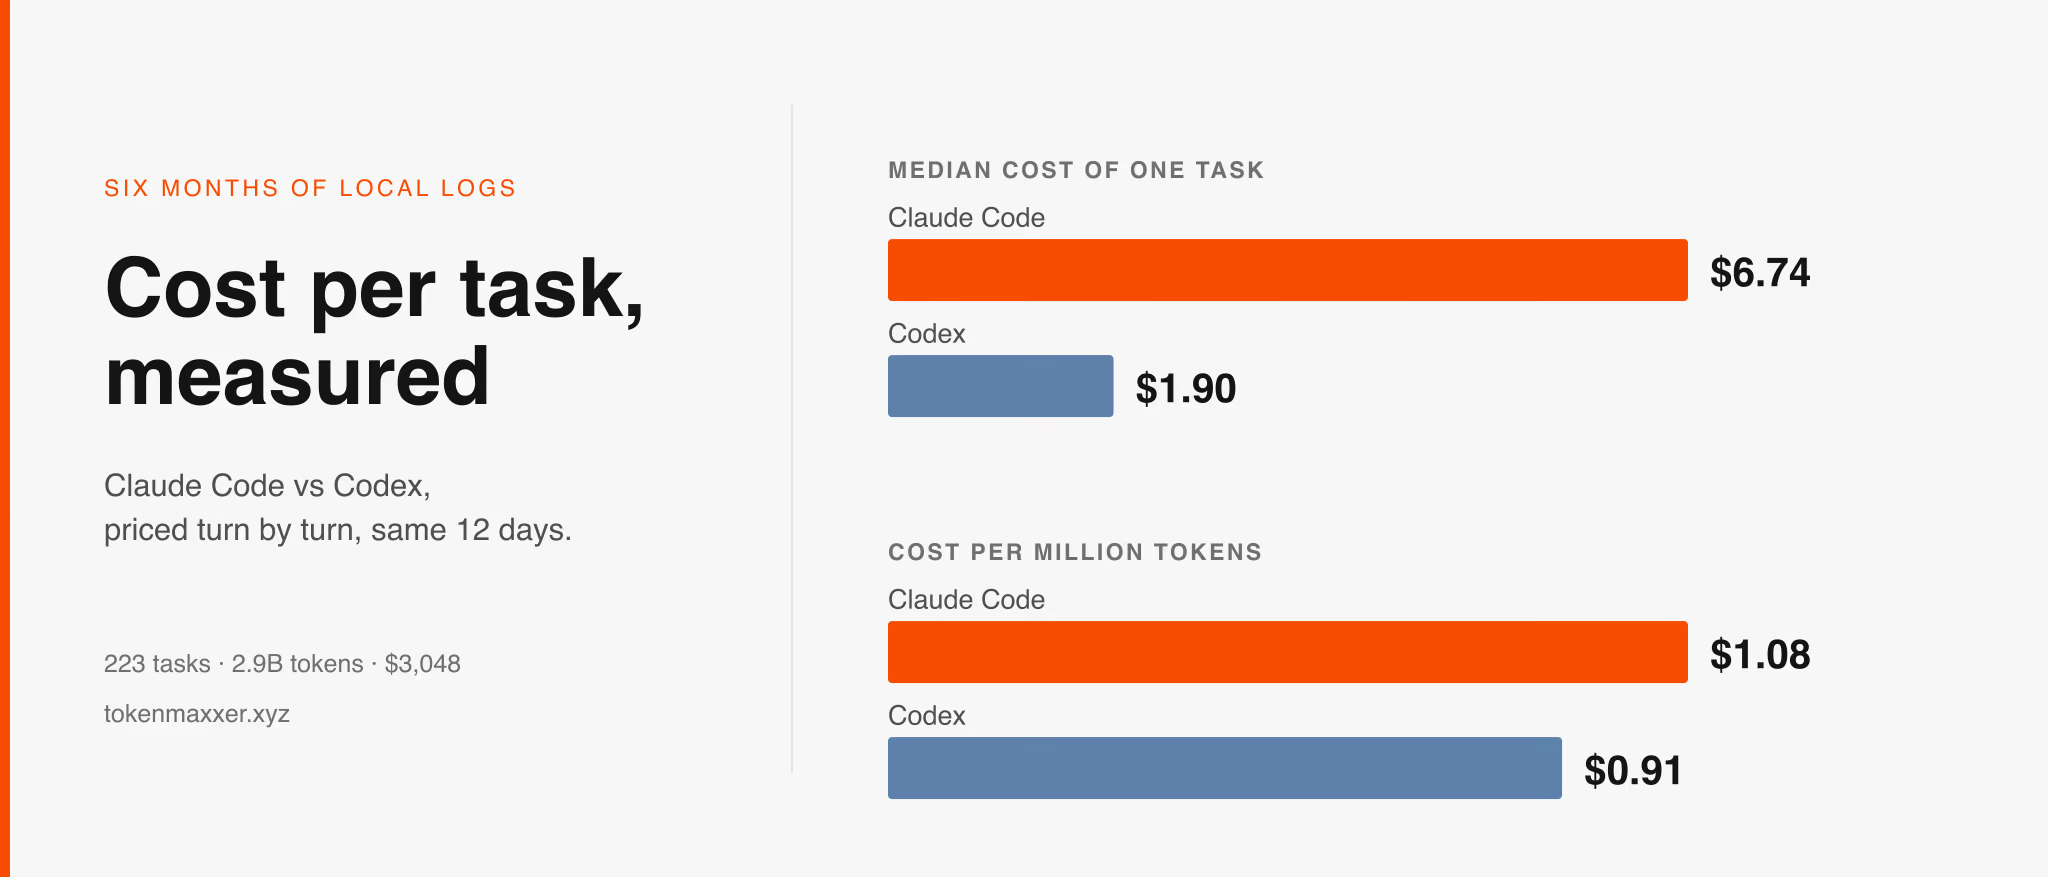
I priced six months of my own agent sessions turn by turn at published API rates. The median Claude Code task — one continuous working session — came to $6.74. Against that unit:
| Monthly budget | Tasks per month | Tasks per working day |
|---|---|---|
| $200 | ~30 | ~1.4 |
| $500 | ~74 | ~3.5 |
| $1,500 (Uber's cap) | ~222 | ~10.6 |
| $2,000+ (Gartner's top 6%) | ~300 | ~14 |
Look at the first two rows. The band a quarter of the industry lands in buys one to three and a half agent sessions a day. That is not extravagance. That is one engineer using the tool the way it is meant to be used, and it is the number that should be in a budget model instead of a seat count.
The bottom rows are a different animal. Fourteen sessions a day is not a person typing; it is someone running a fleet of agents in parallel. Both of those are legitimate patterns. They differ by 10x, and no per-seat forecast can tell them apart in advance.
One more finding transfers, and it is the one that decides where cost control is worth doing: in my data the top 10% of tasks consumed 48.2% of total spend. Half the money sat in a handful of runaway sessions. Trimming the cheap majority would have saved nothing.
The visibility gap is the real problem
If the numbers above feel unknowable, that is the actual state of the industry, and it is measured.
KPMG's Global AI Pulse for Q2 2026 surveyed more than 2,000 senior leaders at companies above $50 million in revenue, across 20 countries:
- 42% report only partial visibility into their AI spending
- 33% cite limited understanding of token-based pricing
- 49% have scaled back AI agent deployments over cost concerns
- 7% report established ROI from AI
And the finding that ties the rest together: leaders with strong cost visibility were five times more likely to report established ROI — 15% against 3%.
Other surveys land in the same place from different angles. CloudBees found that while 68% of enterprise leaders believe AI has delivered business value, organizations can attribute only about a third of their AI spend to specific outcomes. DX found 86% of budget holders unsure which of their tools were actually helping.
Read those together and the 49% who scaled back agents were not necessarily overspending. Some of them were flying blind and pulled up, which is what you do when you cannot see the ground.
What to do about it
The companies that handled 2026 well did roughly the same four things.
Budget consumption as consumption. Take a real cost-per-task figure — yours, not a benchmark — and multiply by the sessions you expect. A seat count times a seat price is not a forecast for a metered product.
Make the number visible to the person spending it. Uber's cap came with a dashboard. That ordering matters: a limit nobody can see coming is just an outage waiting to happen mid-sprint.
Fix model tier before you fix behaviour. A nine-to-one spread per million tokens means routing routine work to a cheaper tier saves more than any amount of prompt discipline. Current rates for every model are on the models page.
Watch the tail, not the mean. If half your spend is in 10% of sessions, the mean is a distraction. The useful alert is "this session has been running for two hours," not "this team is above average."
And measure cache hit rate if you can see it. On sustained agent work it should be high — mine ran above 99% — and anything below roughly 60% means context is being rebuilt from scratch most turns while you pay the full input rate for it.
That is the gap TokenMaxxer exists to close. It reads the session logs your tools already write to your own machine, keeps the four counters apart, prices every turn at published rates, and gives you a per-developer, per-task number instead of an invoice total. No wrapper, no proxy, nothing to instrument.
Frequently asked questions
How much do companies spend on AI coding tools per developer?
Roughly $200 to $500 per developer per month on tokens, which is where about 23% of technology leaders landed in Gartner's June 2026 data. About 6% spend more than $2,000 per developer per month. Seat licenses ($20–$40) sit on top of that and are the smaller line.
How much are companies spending on AI overall?
Menlo Ventures put total enterprise AI spend at $37 billion in 2025, roughly tripling year over year, with $12.5 billion of it on foundation model APIs and about $4 billion on coding specifically. Per employee, Ramp's July 2026 data shows a median US business spending $11.95 per employee while the top 1% spend $7,400.
Will AI coding costs really exceed developer salaries?
Gartner predicts AI coding costs will surpass the average developer's salary by 2028, driven by rising token consumption and consumption-based pricing. It is already true in some markets: Gartner notes token costs in India now equal the salary of an engineer with four to six years of experience, because token prices do not vary by region and salaries do.
Why did Microsoft cancel its internal Claude Code licenses?
Cost. Microsoft moved most of its Experiences + Devices engineers off Claude Code and onto GitHub Copilot CLI by June 30, 2026, after per-engineer API costs reached a reported $500 to $2,000 a month. Consolidating onto a first-party tool converts an external bill into internal cost.
What is Claudeonomics?
Claudeonomics was Meta's internal dashboard ranking employees by AI token consumption — around 60 trillion tokens across a 30-day window before it was shut down in 2026. Amazon ran a similar leaderboard and killed it after employees gamed their rankings, behaviour it internally called tokenmaxxing.
Why are AI coding bills so unpredictable?
Because they are metered on four counters with different rates — input, output, cache writes and cache reads — and an agent re-reads its context on every turn. Cost tracks session length and model tier far more than task difficulty, so two developers with similar output can differ several-fold in spend.
Is a $20 AI coding seat enough for a professional developer?
For inline completion, often yes. For agentic work it is not the binding cost: the tokens an agent consumes typically run an order of magnitude above the seat. Budget the seat as access and the tokens as the actual spend.
How do I track AI spend per developer?
The session logs written locally by Claude Code, Codex and similar tools carry per-turn token counts, which can be priced against published rates to give a per-developer and per-task figure. That is what TokenMaxxer does. Vendor dashboards typically show an account total, which is the number that hides the tail where most of the money sits.
Sources
- Gartner: AI coding costs will surpass the average developer salary by 2028 (June 24, 2026), and The Register's coverage with analyst commentary
- Ramp AI Index, August 2026 — anonymized spend across 70,000+ US businesses
- Menlo Ventures, 2025: The State of Generative AI in the Enterprise
- KPMG Global AI Pulse, Q2 2026 — 2,000+ senior leaders across 20 countries
- Uber caps employee AI spending after blowing through budget in four months, TechCrunch
- Meta's Adam Mosseri says AI token budgets could soon be capped per engineer, TechCrunch
- Microsoft cancels Claude Code licenses, shifting developers to GitHub Copilot CLI, Windows Central
- Amazon shuts down internal AI leaderboard after employees cheated, 404 Media
- How engineering leaders are approaching 2026 AI tooling budgets, DX
- 2026 State of Code Abundance, CloudBees
- Anthropic run-rate revenue milestones, collated from Anthropic's own announcements
- Per-task figures from Claude Code vs Codex: cost per task, measured — six months of local session logs priced at published rates
Industry figures are other people's surveys and carry their sampling; the per-task numbers are one developer's logs on one codebase. Both are worth exactly as much as your own measurements, which is the argument for taking them.