AI Cost Tracker: What It Is and How to Choose One in 2026

I pointed an AI cost tracker at my own laptop and found $3,778 of AI spend across eight different tools — none of which had ever shown me a total. Four point three billion tokens, 20,400 turns, 83 active days. The most recent month ran at $116 a day.
Not one of those tools could tell me that number. Each knows its own slice, most report it as a usage bar rather than a dollar figure, and nothing on my machine added them up. That gap is the entire reason AI cost trackers exist, and it is why "AI cost tracker" now returns everything from a Chrome extension to an enterprise observability suite — three different products wearing one name.
This post answers the questions people actually ask about AI cost tracking: what one is, which kind you need, how to track AI costs across every tool you use, how much this really costs per developer, and how to cut the bill once you can finally see it.
What is an AI cost tracker?
An AI cost tracker is a tool that collects token usage from the AI models, coding agents and APIs you use, prices each unit at its correct rate, and reports what you actually spent — broken down by model, tool, project and day. It exists because AI billing is metered on several counters with different prices, so raw usage numbers cannot be converted into dollars by anyone who is not tracking all of them.
That is the whole job, and the second sentence is the hard part. Everything below is a consequence of it.
What are the three kinds of AI cost tracker?
Search for an AI cost tracker and you get three genuinely different product categories. Buying the wrong one is the most common mistake here, so start by finding your row.
| Kind | Tracks | Built for | Typical answer it gives |
|---|---|---|---|
| Subscription trackers | Recurring AI bills and seats | Individuals, finance | "You pay $164/mo across 7 AI subscriptions" |
| LLM observability platforms | API calls your product makes | Teams shipping AI features | "This endpoint costs $0.004 per request" |
| Developer usage trackers | Tokens your coding tools burn | Developers and eng teams | "Claude Code was 93% of your spend last month" |
Subscription trackers watch the recurring charges — a ChatGPT Plus seat, a Cursor subscription, an API account minimum. They are budgeting tools. They will never see a token, and if your spend is usage-based they will miss almost all of it.
LLM observability platforms — Langfuse, Helicone, Portkey, Datadog, Coralogix and the rest — sit in the path of the API calls your own application makes and attach a cost to each trace. They are the right answer when you ship an AI feature and need cost-per-request. They are the wrong answer for the tokens you personally burn in a coding agent, because your agent's traffic never passes through your proxy.
Developer usage trackers read what the coding tools write to disk and price it. This is the category that barely existed in 2024 and now matters most, because agentic coding is where consumption actually exploded. It is also the category TokenMaxxer is in.
The distinction that trips people up: an enterprise FinOps platform and a local usage tracker are both correctly described as an AI cost tracker, and neither can do the other's job. If your problem is "what did my team spend on Claude Code and Cursor last month", an observability platform will return an empty dashboard no matter how good it is.
Why is your token count not your bill?
Here is the finding that justifies the whole category, measured on my own machine rather than argued from a pricing page.
95.2% of the tokens I have ever used were cache reads. Not input. Not output. Cache reads — the context an agent re-reads on every single turn of a session.
Cache reads are billed at roughly a tenth of the input rate. So that 95.2% of my token volume accounted for 58.5% of my cost, while output tokens — 0.45% of the volume — took 13.8% of the money.
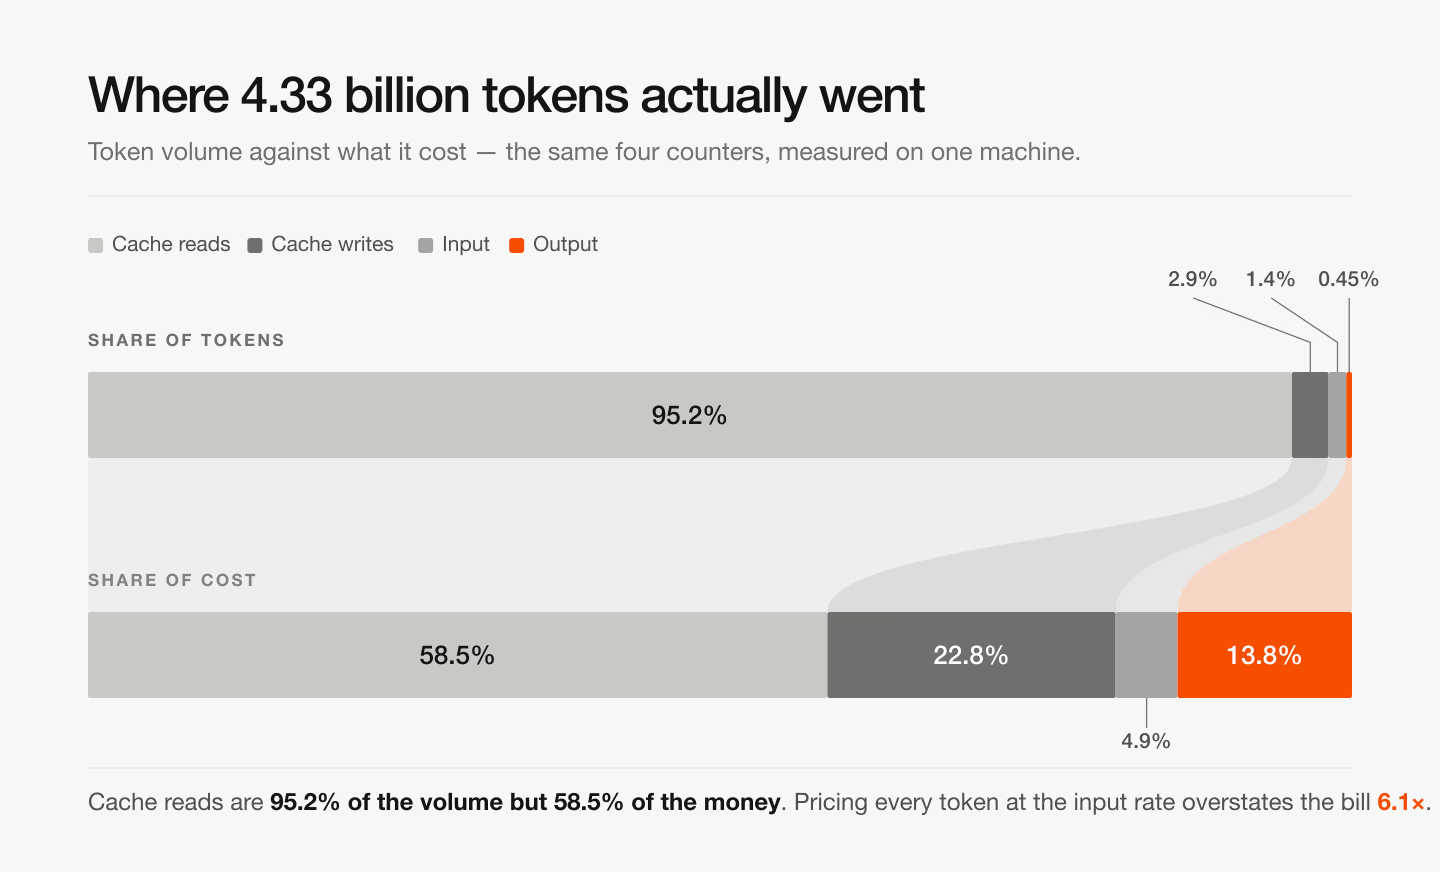
Now the consequence. If you take a total token count and multiply it by a model's input price — which is what almost every back-of-envelope estimate does, and what more than one dashboard does — here is what you get on my numbers:
| Method | Result |
|---|---|
| All 4.33B tokens priced at the input rate | $23,079 |
| Actual cost, each counter at its own rate | $3,778 |
| Error | 6.1× overstated |
Six times. That is not a rounding difference, it is the difference between "our AI spend is unsustainable" and "our AI spend is a rounding error against salaries" — and teams have made real decisions on the wrong one of those.
The blended rate across everything I ran works out to $0.87 per million tokens. Every headline model price is several times that. The gap is cache, and it is the single largest reason a naive AI cost tracker is worse than none: it produces a confident number that is wrong in a consistent direction.
So the first question to ask any AI cost tracking tool is not which models it supports. It is whether it keeps input, output, cache reads and cache writes as four separate counters. If it reports one "tokens used" figure, it cannot be pricing correctly, because the information needed to do so was thrown away before it got to the total.
How much does AI actually cost one developer?
The rest of the measurement, for calibration. This is a single developer, one machine, everything from June 2025 to August 2026.
| Total AI spend | $3,778 |
| Total tokens | 4.33 billion |
| Turns | 20,400 |
| Tools found | 8 |
| Active days | 83 |
| Last 30 days | $116.23 per active day |
| Blended rate | $0.87 / million tokens |
And the split by tool, which is the part no individual tool can show you:
| Tool | Share of cost |
|---|---|
| Claude Code | 93.1% |
| Cursor | 4.1% |
| Codex | 2.7% |
| Everything else (5 tools) | 0.1% |
Two things worth pulling out.
Eight tools were running that I had not consciously chosen to fund. Antigravity, Pi, Grok Build, OpenCode — each tried once, each still writing usage to disk. Individually trivial. The point is that I did not know they were there, and a spend you do not know about is a spend you cannot decide about.
One tool was 93% of the bill. That is the number that changes behaviour. Not the total — the concentration. Once you can see it, every optimisation question has an obvious first target, and the other seventeen tools stop being worth a minute of anyone's attention.
That $116 per active day is also worth sitting with, because it is not an outlier. Gartner's June 2026 data has 23% of technology leaders spending $200–$500 per developer per month on tokens and about 6% spending over $2,000 — figures I went through in detail in what companies actually spend on AI coding tools. A $20 seat license has not been the real cost of AI coding for some time.
What should an AI cost tracker do?
Seven things. The first three are non-negotiable; the rest are what separates a tracker you keep from one you install and forget.
- Split the four counters. Input, output, cache reads and cache writes, priced separately. Anything reporting a single token total is guessing, in the expensive direction.
- Price per model, from a maintained table. Rates change, models ship weekly, and a stale price table fails silently — the number still looks reasonable. TokenMaxxer keeps every model and its rates in one registry for exactly this reason.
- Cover every tool you use. A tracker that sees one agent tells you about one agent. The spend that surprises you is always in the tool you forgot about.
- Attribute to projects. "You spent $3,778" is trivia. "This client's repo cost $840" is something you can bill, budget or stop.
- Read data you already have. The best AI cost tracking setup requires no proxy, no API key and no change to how your tools run — the logs are already on disk.
- Keep prompts out of it. Usage tracking needs counts, not conversations. Any tool that uploads transcripts to compute a cost is taking a risk it does not need to take.
- Show a trend, not a total. A number without a direction cannot tell you whether last week's change helped.
Which AI cost tracker should you use?
An honest map of the landscape, including the tools that compete with ours. Pick by the row you identified earlier, not by which has the longest feature list.
| Tool | Category | Best for | Notes |
|---|---|---|---|
| TokenMaxxer | Developer usage | Devs and teams on coding agents | Free, local-first, 18 tools, four-counter pricing, opt-in public profile |
| CodeBurn | Developer usage | Devs wanting local-only | Free, local logs, wide tool coverage, no account |
| StackSpend | Developer usage | Eng managers | Team and per-user views, anomaly alerts |
| CostGoat | API spend | API-key users | Real-time balance and low-balance alerts |
| Langfuse | LLM observability | Teams shipping AI features | Open source, per-trace cost, self-hostable |
| Helicone | LLM observability | Proxy-friendly stacks | One-line proxy, gateway features, caching |
| CloudZero / Finout | Cloud + AI FinOps | Finance and platform teams | Ties AI spend to cloud and business units |
| Native dashboards | Per-vendor | Single-vendor shops | Accurate for that vendor, blind to the rest |
The category error to avoid: Langfuse and Helicone are excellent and will not help you track what Claude Code cost you this week, because your agent does not route through them. Equally, a local usage tracker will not give you cost-per-request for the chatbot you shipped. Most engineering organisations past a certain size end up running one from the observability column and one from the developer column, and that is the correct outcome rather than a redundancy.
How do you track AI costs?
Two routes, depending on whether you want to build it or use one.
Track AI costs yourself
Every major coding tool already writes usage to disk. Nothing needs to be enabled:
- Claude Code — JSONL under
~/.claude/projects - Codex —
~/.codex/sessions - Cursor — a SQLite store in its application-support directory
- Gemini / Antigravity —
~/.gemini - Copilot — OpenTelemetry output under
~/.copilot/otel
Parse them, keep the four token counters separate, join each turn to its model's published rates, and sum. Budget a weekend for the first tool and a recurring maintenance cost forever — every format changes, and the pricing table moves whenever a provider ships.
Or use an AI cost tracker
The reason the do-it-yourself route is written out above is that it is genuinely the whole algorithm. The reason almost nobody finishes it is the maintenance.
TokenMaxxer is that parser, kept current, for 18 tools:
npm i -g tokenmaxxer && tokenmaxxer login
It reads the logs already on your machine, prices every turn per model with the four counters kept separate, and gives you the breakdown by model, tool and provider that this post is made of. Raw transcripts never leave your machine — only aggregate counts sync, and appearing on the public leaderboard is strictly opt-in. It is free.
Everything I have quoted here came out of it, which is the only real recommendation I can offer: I use this on my own machine and the numbers above are what it produced.
How do you reduce AI costs once you can see them?
Tracking is not the point. This is. Here are the four levers, sized against my own measured spend rather than quoted from a vendor page.
Prompt caching is already doing most of the work
Priced without caching — every cached token charged as fresh input — my same 4.33 billion tokens would have cost $23,550 instead of $3,778. Caching saved about $19,800, or 84%.
That is not a tactic you need to adopt; on Claude Code and most modern agents it is on by default. It is a reason to check it is working, because the failure mode is silent. Anthropic prices cache reads at exactly 90% off input — on Opus 5, $0.50 against $5.00 per million tokens — while a cache write costs 1.25× input. So caching pays only when a prefix gets reused, and it loses money on a prompt that is written once and never read again. Short one-shot calls with a big system prompt are where this quietly goes wrong.
Model choice is the biggest remaining lever
Repricing every turn I ran at Sonnet 5's rates gives $2,187 instead of $3,778 — 42% cheaper for identical token volume.
Read that as the size of the prize, not as advice to switch. It assumes the same work takes the same tokens on a smaller model, which is exactly what you cannot assume: if a cheaper model needs three attempts where the frontier one needed a single pass, the saving inverts. The honest version is that model tier is where 42% of my bill lives, so it is the only lever worth measuring properly — route the easy work down, keep the hard work where it is, and check the totals next month.
Cap output tokens
Output was 0.45% of my token volume and 13.8% of my cost. Per token it is the most expensive thing you buy — roughly 50× a cache read on Opus 5. Capping max output tokens and asking for shorter answers is a small change against a line item that is disproportionately large.
Attribute spend to projects, then decide
The lever nobody counts as a lever. Five of my eight tools were 0.1% of spend combined, and one was 93%. Until you can see that split, optimisation effort gets spread evenly across things that do not matter. Per-project attribution turns "we spend too much on AI" into "this repo cost $840 last month", which is a sentence someone can act on — bill it to the client, budget it, or stop doing it.
What changes once you can see it
The honest answer is not that you spend less. It is that you stop guessing.
Before I had a working AI cost tracker I could not have told you within an order of magnitude what I spent on AI, and I would have guessed high — the $23,079 figure is roughly what my instinct said, because instinct prices everything at the headline rate. Being wrong by 6× in that direction has a cost of its own: it is the reasoning behind every team that has throttled a tool that was actually cheap.
What the real numbers gave me was narrower and more useful. One tool is 93% of the bill, so that is the only one worth tuning. Cache reads dominate volume but not cost, so session length matters less than I assumed and model tier matters more. Seven tools are noise and can be ignored entirely. None of that is visible without measurement, and all of it took one command to find.
Claim a free profile and point it at your own machine. The first number it shows you is usually the interesting one.
Frequently asked questions
What is an AI cost tracker?
An AI cost tracker is a tool that collects token usage from the AI models, agents and APIs you use, prices each unit at its correct rate, and reports actual spend broken down by model, tool, project and day. It exists because AI billing is metered on several counters with different prices, so a raw usage figure cannot be converted into a dollar amount without tracking all of them.
How do I track AI costs?
Point a tracker at the usage logs your tools already write to disk, rather than reading each vendor's dashboard separately. The algorithm is: parse the logs, keep input, output, cache read and cache write tokens as four separate counters, price each against the model's published rate, and sum by day, tool and project. Doing this yourself is a weekend per tool plus permanent maintenance; a tool like TokenMaxxer is one install command.
How do I track AI costs across multiple tools?
Use a tracker that reads local usage logs instead of one dashboard per vendor. Claude Code, Codex, Cursor, Copilot, Gemini and most agents each record token counts on disk, so a single reader can price all of them against one model table and produce a combined total. Per-vendor dashboards cannot do this because each only ever sees its own traffic — on my machine, eight separate tools were spending money and nothing was adding them up.
Why is my token count different from my bill?
Because tokens are billed on four separate counters at different rates: input, output, cache reads and cache writes. Cache reads cost around a tenth of input. In 4.33 billion measured tokens, cache reads were 95.2% of the volume but only 58.5% of the cost, and pricing every token at the input rate overstated the real bill by 6.1 times.
How can I reduce my AI costs?
Four levers, in order of size. Confirm prompt caching is working — on measured data it was already saving 84%. Route easy work to cheaper models: repricing the same work at Sonnet rates was 42% cheaper. Cap output tokens, which are the priciest per token and were 13.8% of cost from 0.45% of volume. Then attribute spend per project so effort goes where the money actually is — one tool was 93% of my bill.
Does prompt caching actually save money?
Yes, substantially, and it is usually on by default. Measured across 4.33 billion tokens, pricing every cached token as fresh input would have cost $23,550 against an actual $3,778 — an 84% saving. The caveat is that a cache write costs more than a normal input token, around 1.25× on Anthropic models, so caching only pays when the cached prefix is read again. One-shot calls with a large system prompt can cost more with caching than without.
Is there a free AI cost tracker?
Yes. TokenMaxxer is free and reads usage locally from 18 coding tools. CodeBurn is another free local-first option, and Langfuse and Helicone are open source if you need API-level tracing for an application you ship rather than the tools you code in.
How do I track AI costs by team or project?
Pick a tracker that attributes each turn to the workspace it ran in, then roll those up per person. Local trackers can do this because the log records which directory the session ran in; a vendor dashboard usually cannot, because it only sees an API key. For a team, each developer runs the tracker locally and syncs aggregate counts, which gives per-person and per-project totals without anyone uploading code or prompts.
What is the difference between an AI cost tracker and LLM observability?
An AI cost tracker answers what you spent, broken down by tool, model and project. LLM observability answers what a specific request did — its trace, latency, prompt, and cost per call — for an application you built. Observability platforms only see traffic routed through them, so they cannot see what your coding agent spent.
What is the difference between AI cost tracking and AI cost management?
Tracking is measurement: what was spent, on what, by whom. Management is control: budgets, alerts, rate limits, approvals and chargeback. You cannot do the second without the first, and most teams need tracking long before they need governance — a budget enforced against a number you do not trust is worse than no budget.
How much do developers actually spend on AI coding tools?
More than the seat price. On my own machine the last 30 tracked days averaged $116 per active day, and Gartner's June 2026 data puts 23% of technology leaders at $200–$500 per developer per month on tokens with about 6% above $2,000. The $20 subscription is access; the tokens are the actual bill.
What metrics should an AI cost tracker show?
At minimum: spend and tokens per day, split by the four token counters; cost by model, by tool and by project; and a trend rather than a running total. Blended cost per million tokens is the single most useful derived figure, because it exposes the effect of caching and model mix in one number — mine is $0.87 against headline rates several times higher.
Does an AI cost tracker need access to my prompts?
No, and it should not ask for them. Cost is computed from token counts, model ids and timestamps — none of which require the content of a conversation. TokenMaxxer never uploads raw transcripts; only aggregate counts sync, and only for accounts that opt in.
Can I track AI costs on a subscription rather than an API key?
Yes, and it is arguably more useful there. On a subscription you are not invoiced per token, so the tracker reports list-price equivalents: what the same work would have cost through the API. That is the only way to compare tools with different billing models, and it is also the number that tells you whether your subscription is a bargain or whether you are leaving money on the table.
Can I track AI costs for a whole team?
Yes. Each developer runs the tracker locally and syncs aggregate counts, which gives per-person and per-project totals without anyone shipping their code or prompts anywhere. That is also the only way to get a true team figure when people use different tools — vendor dashboards will each report a fraction and none will report the sum.